
Type of resources
Available actions
Topics
INSPIRE themes
Keywords
Contact for the resource
orgNameSNIG
Provided by
Years
Formats
Representation types
Update frequencies
Status
Service types
Scale
Resolution
geoDescCode
cartografia
geographicCoverage
geographicCoverageDesc
inspirecore
hvd
referenceDateRange
denominatorRange
resolutionRange
dataPolicy
openServiceType
dataType
dataFormat
-
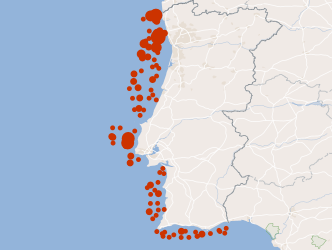
Web Map Visualization, INSPIRE (ISO19128-WMS 1.3.0) compliance, from monitoring campaigns that IPMA conducts regularly since 1996, of bivalve molluscs banks that occur in the oceanic coast of the South West zone, in order to assess their condition. These campaigns allow the adjustment of the fishing effort and fishing quotas to the state of resources in order to not compromise its sustainability. This resource shows the geographic distribution biomass The present resource presents the geographic distribution of the biomass index of White Clam (Spisula solida) in June 2014, European Hake (Merluccius merluccius) in September 2010 and Norway lobster (Nephrops norvegicus) in June 2010.
-
Visualization service (WMS) from Annual Map of the number of days with precipitation ≥10mm in the period 1971-2000, obtained by ordinary kriging from the surface observations network of climatological stations of the Institute of Meteorology and the pluviometric stations from INAG for Portugal mainland.
-
Web Map Visualization, INSPIRE (ISO19128-WMS 1.3.0) compliance, of the Annual Map of the number of days with minimum air temperature ≤0ºC (Number of days of frost) in the period 1971-2000, obtained by ordinary kriging from the surface observations network of climatological stations of the Institute of Meteorology and the pluviometric stations from INAG.
-
Map of the seasonal maximum air temperature, mean values of the period 1971-2000, obtained by multivariate regression with altitude and distance to the coast, explanatory variables, and ordinary kriging of residues.
-
Visualization service (WMS) from Map of the monthly minimum air temperature, mean values of the period 1971-2000, obtained by multivariate regression with altitude and distance to the coast, explanatory variables, and ordinary kriging of residues.
-
Visualization service (WMS) from monthly maximum air temperature, mean values of the period 1971-2000, obtained by multivariate regression with altitude and distance to the coast, explanatory variables, and ordinary kriging of residues.
-
Visualization service (WMS) from monthly total precipitation, during the period 1971-2000, obtained by multivariate regression with altitude and distance to the coast, explanatory variables, and ordinary kriging of residues.
-
Web Map Visualization, INSPIRE (ISO19128-WMS 1.3.0) compliance, of the monthly minimum air temperature, mean values of the period 1971-2000, obtained by multivariate regression with altitude and distance to the coast, explanatory variables, and ordinary kriging of residues.
-
Visualization service (WMS) from Map of the monthly minimum air temperature, mean values of the period 1971-2000, obtained by multivariate regression with altitude and distance to the coast, explanatory variables, and ordinary kriging of residues.
-
Visualization service (WMS) from monthly minimum air temperature, mean values of the period 1971-2000, obtained by multivariate regression with altitude and distance to the coast, explanatory variables, and ordinary kriging of residues.