
Format
WMS
821 record(s)
Type of resources
Available actions
INSPIRE themes
Keywords
Contact for the resource
orgNameSNIG
Provided by
Years
Formats
Representation types
Update frequencies
Status
Service types
Scale
Resolution
geoDescCode
cartografia
geographicCoverage
geographicCoverageDesc
inspirecore
hvd
referenceDateRange
denominatorRange
resolutionRange
dataPolicy
openServiceType
dataType
dataFormat
-
Estabelecimentos abrangidos (DL 150/2015): Localização pontual; Estabelecimento; Nível de Perigosidade (Superior/Inferior)
-
Inclui os "números de polícia", "troços" e "edificado" da Região Autónoma dos Açores
-
Serviço de Visualização (WMS) da Ortoimagem da ilha do Corvo - 2017/2018 - Região Autónoma dos Açores (RAA). Imagens WorldView ortorretificadas com recurso a um modelo digital de terreno (DTM) de alta resolução (50 cm) e a ground control points (GCP).
-
Serviço de Visualização (WMS) da Ortoimagem da ilha de São Jorge - 2017/2018 - Região Autónoma dos Açores (RAA). Imagens WorldView ortorretificadas com recurso a um modelo digital de terreno (DTM) de alta resolução (50 cm) e a ground control points (GCP).
-
O PDM de Angra do Heroísmo tem por área de intervenção a totalidade do território do município, constituindo o instrumento definidor das linhas gerais da política de ordenamento e gestão do território. Esta é a terceira carta do plano onde são representadas servidões administrativas relativas à eletricidade do concelho. (Regulamento: http://www.cmah.pt/fotos/textos_temas/01407146650.pdf)
-
Serviço de Visualização (WMS) da Ortoimagem da ilha de Santa Maria - 2017 - Região Autónoma dos Açores (RAA). Imagens WorldView ortorretificadas com recurso a um modelo digital de terreno (DTM) de alta resolução (50 cm) e a ground control points (GCP).
-
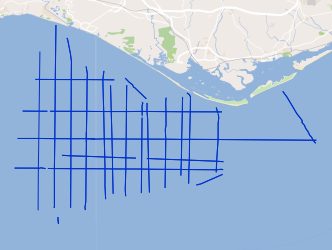
ASTARTE geophysical campaigns aim to collect the necessary information for the assessment, strategy and risk reduction for Tsunamis in Europe.
-
Three-hourly forecast maps of medium cloud cover in percentage in the Iberian Peninsula, generated with the AROME model at 00UTC for the next 48 hours. This visualization service includes the individual layers and also a multidimensional layer that brings all of them together.
-
Serviço de Visualização (WMS) da Planta de Condicionantes e Planta de Síntese do Plano de Ordenamento das Bacias Hidrográficas das Lagoas Branca, Negra, Funda, Comprida, Rasa, Lomba e Patas (POBHL Flores), publicado pelo Decreto Regulamentar Regional n.º 6/2013/A, de 8 de julho.
-
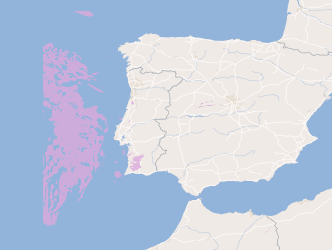
Visualization service (WMS) from Map of the monthly mean air temperature, mean values of the period 1971-2000, obtained by multivariate regression with altitude and distance to the coast, explanatory variables, and ordinary kriging of residues.