
Topic
geoscientificInformation
210 record(s)
Type of resources
Available actions
Topics
INSPIRE themes
Keywords
Contact for the resource
Provided by
Years
Formats
Representation types
Update frequencies
Status
Scale
Resolution
geoDescCode
cartografia
geographicCoverage
geographicCoverageDesc
inspirecore
hvd
referenceDateRange
denominatorRange
resolutionRange
dataPolicy
openServiceType
dataType
dataFormat
-
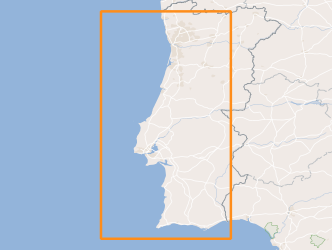
The marine energy potential maps for mainland Portugal consists of the mapping the main wind and wave parameters for the offshore environment at the height of 100m (offshore wind resource) and at surface (wave energy resource). The offshore wind resource is performed with a sophisticated mesoscale atmospheric model, capable of describing the main wind phenomenology near the Portuguese coast, and contains the mapping of the average wind speed [m/s], Wind Power Flux [W/m2] and the map of the annual number of hours at full capacity NEPS of a standard reference turbine as well as the NEPS maps [h/year] for specific type of bottom-fixed wind turbine systems - "Jacket" and "Monopile" or Floating – WindFloat. The offshore wind resource maps represent the climatology of the wind resource as well as characteristics of the wind phenomenology associated to the land-sea interaction along the Portuguese coast. Regarding the wave energy maps, the estimation of the wave energy resource is based in estimating the main sea-wave characteristics and the wave energy production for standard different wave system types – oscillation water column converter; floating two-body heaving converter bottom-fixed oscillating flap converter. The maps of the wave energy resource are a merging of observational data (boys) and information from the ONDATLAS database as well as data from numerical modeling with the MAR3G model all with 10 years of data . This way the wave energy resource maps describe the main characteristics of the average wave resource for a period of 10 years, which is representative of the sea state climatology of Portugal. All wave energy maps are expressed in [kW/m]. Also, all wind and wave energy resource maps are processed with a high spatial resolution of 1km x 1km from the coast up to the bathymetric of 300m. Some wind and wave energy maps are freely available to download in a course but larger grid area (5Km x 5Km). In time, the offshore wind maps will include higher heights.
-
The “National Atlas of Sustainable Green H2” is a tool based on georeferenced information that follows defined criteria in the development of scenarios to assess the suitability of the location of green hydrogen production projects with regard to: (i) necessary resources to power hydrogen production plants through water electrolysis; (ii) land use conditions for the implementation of green hydrogen production units, and (iii) factors that enhance the commercialization of the produced hydrogen. Based on this “National Atlas of Sustainable Green H2” tool, we present 4 maps referring to 4 scenarios that identify the “best” areas for green hydrogen production according to the basic rationale of each scenario. The 4 maps represent the following scenarios: scenario A “Diversified”, scenario B “Drought, Gas Grid and Transport”; scenario C “Drought and gas consumers”; scenario D “Prospective”. Each scenario was developed based on 3 sub-indices (i) proximity to water sources, (ii) proximity to energy sources and (iii) ease of commercializing green H2 on the market. The water sub-index consists of a maximum of 7 indicators considering the proximity to the following potential water sources: surface water bodies, wastewater treatment plants (WWTPs), public water network, groundwater, seawater, multi-purpose irrigation grid, water scarcity index. The energy sub-index consists of a maximum of 6 indicators, namely: solar resource, onshore wind resource, offshore wind resource, proximity to bioelectricity producers, proximity to hydropower producers, proximity to the power grid. Finally, the market sub-index is made up of a maximum of 5 indicators, including proximity to: potential industry consumers of H2, potential transport consumers of H2, potential consumers of H2 as raw material, large CO2 emitters. Each final map excludes from potential project locations land occupation that proves to be inappropriate. The following are not yet considered: easements and public utility restrictions, RAN and REN areas, Territorial Planning Plans, municipality land planning (PDM), SEVESO Directive hazardous zones, protected areas under the Water Framework Directive , seismicity, flood risk and/or geologically unstable areas (erosion, landslides, etc.). This Atlas requires a detailed analysis of sites considering all applicable legislation. The geographic information used has inherent limitations regarding date, scale, resolution and sources. Furthermore, the viability assessment for a specific project requires detailed information that goes beyond the variables contained in this Atlas and considers other decision-making and legal compliance factors, which cannot be considered at this scale.
-
9 chrono-stratigraphic surfaces (tops) obtained from seismic reflection data calibrated by drill-holes and interpreted with geological and other geophysical data produced under the scope of a PhD Thesis.
-
Sedimentological characterization of part of the continental shelf. Folk classification (7 classes).
-
The Geothermal Atlas of Mainland Portugal is a mission-driven project of fundamental importance for the geothermal knowledge of the country, systematically carried out at the National Laboratory of Energy and Geology (LNEG) for over 30 years. It was created following other mapping projects, incorporating diverse information from various data sources obtained for different purposes, from different institutions, and harmonized and processed in a way that allows it to be applied to information, dissemination, training, promotion, and research on geoenergy in mainland Portugal, thus serving as a lever for the sector's development. It constitutes a dynamic and constantly updated research effort, integrating various parameters from diverse origins applicable to geoenergy studies. Its integrated and homogenized processing allows for a visualization of the country's geothermal characteristics on a national scale and can be used to determine geothermal potential at various scales. As sources of information for the production of geothermal mapping of mainland Portugal, processed and directed towards the various types of geothermal energy and geothermal exploitation, the first works began more than 40 years ago, forming the basis of Portuguese contributions to successive European Atlases of Geothermal Resources, the last of which was published in paper in 2002 with updates published in 2025 in the European Geological Data Infrastructure. This information is constantly complemented by additional geothermal information, whose original acquisition was made for geothermal purposes, and also by information acquired for other geoscientific objectives. The incorporation of information is done according to established criteria.
-
-
-
Geological model of the volcanogenic massive sulfides deposit of Lagoa Salgada (Iberian Pyrite Belt) under the scope of a PhD Thesis.
-
-
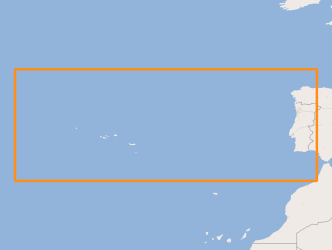
Location of structures resulting from the submarine fluids emissions, such as: mud volcanoes (methane hydrates); Pockmaks (methane) and hydrothermal vents (fluids enriched in salts and metallic elements), located between the Mid-Atlantic Rift zone (Azores archipelago) and the continental margin.