
cl_maintenanceAndUpdateFrequency
daily
40 record(s)
Type of resources
Available actions
Topics
INSPIRE themes
Keywords
Provided by
Years
Formats
Representation types
Update frequencies
Status
Service types
Scale
Resolution
geoDescCode
cartografia
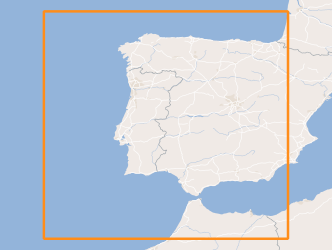
geographicCoverage
geographicCoverageDesc
inspirecore
hvd
referenceDateRange
denominatorRange
resolutionRange
dataPolicy
openServiceType
dataType
dataFormat
-

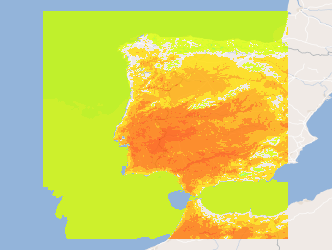
Three-hourly forecast maps of accumulated precipitation in mm/3h in the Iberian Peninsula, generated with the AROME model at 00UTC for the next 48 hours. This visualization service includes the individual layers and also a multidimensional layer that brings all of them together.
-

Three-hourly forecast maps of low cloud cover in percentage in the Iberian Peninsula, generated with the AROME model at 12UTC for the next 48 hours. This visualization service includes the individual layers and also a multidimensional layer that brings all of them together.
-
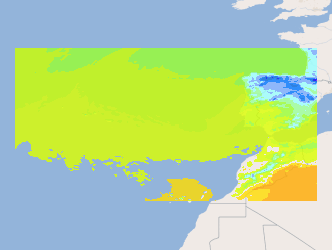
Three-hourly forecast maps of air temperature at 2 meters in Kelvin in the Atlantic region, generated daily from ECMWF data, with forecasts every 3 hours of the current day from 00h to the next 120 hours. This visualization service includes the individual layers and also a multidimensional layer that brings all of them together.
-
Three-hourly forecast maps of accumulated precipitation in mm/3h in the Iberian Peninsula, generated with the AROME model at 12UTC for the next 48 hours. This visualization service includes the individual layers and also a multidimensional layer that brings all of them together.
-
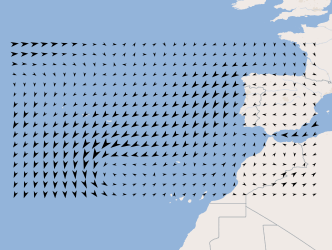
Three-hourly forecast maps of wind direction and intensity at 10 meters in the Atlantic region, generated daily from ECMWF data, with forecasts every 3 hours of the current day from 00h to the next 120 hours. This visualization service includes the individual layers and also a multidimensional layer that brings all of them together.
-

Three-hourly forecast maps of accumulated precipitation in mm/3h in the Atlantic region, generated daily from ECMWF data, with forecasts every 3 hours of the current day from 00h to the next 120 hours. This visualization service includes the individual layers and also a multidimensional layer that brings all of them together.
-
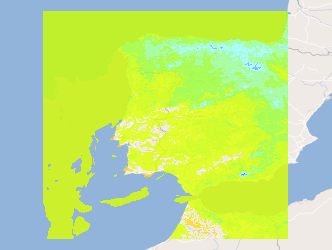
Three-hourly forecast maps of air temperature at 2 meters in Kelvin in the Iberian Peninsula, generated with the AROME model at 00UTC for the next 48 hours. This visualization service includes the individual layers and also a multidimensional layer that brings all of them together.
-
Three-hourly forecast maps of air temperature at 2 meters in Kelvin in the Iberian Peninsula, generated with the AROME model at 12UTC for the next 48 hours. This visualization service includes the individual layers and also a multidimensional layer that brings all of them together.
-

Three-hourly forecast maps of accumulated precipitation in mm/3h for the Iberian Peninsula, generated with the AROME model. The maps are generated twice a day, at 00UTC and 12UTC, with forecasts of the following 48 hours.
-
Three-hourly forecast maps of cloud cover in percentage at three levels (low, medium and high) and total cloud cover for the Iberian Peninsula, generated with the AROME model. The maps are generated twice a day, at 00UTC and 12UTC, with forecasts of the following 48 hours.