
Service type
view
462 record(s)
Type of resources
Available actions
INSPIRE themes
Keywords
Contact for the resource
orgNameSNIG
Provided by
Years
Formats
Update frequencies
Status
Service types
geoDescCode
cartografia
geographicCoverage
geographicCoverageDesc
inspirecore
hvd
referenceDateRange
denominatorRange
resolutionRange
dataPolicy
openServiceType
dataType
dataFormat
-
Estabelecimentos abrangidos (DL 150/2015): Localização pontual; Estabelecimento; Nível de Perigosidade (Superior/Inferior)
-
WMS Three-hourly forecast of the surface pressure in the Atlantic region for the next 5 days (ECMWF)
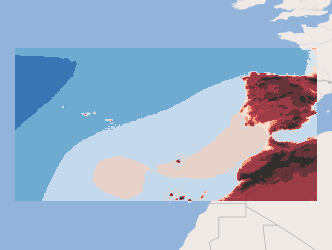
Three-hourly forecast maps of surface pressure in Pascal in the Atlantic region, generated daily from ECMWF data, with forecasts every 3 hours of the current day from 00h to the next 120 hours. This visualization service includes the individual layers and also a multidimensional layer that brings all of them together.
-

Three-hourly forecast maps of low cloud cover in percentage in the Iberian Peninsula, generated with the AROME model at 12UTC for the next 48 hours. This visualization service includes the individual layers and also a multidimensional layer that brings all of them together.
-
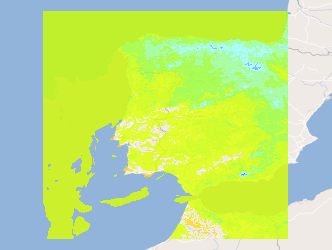
Three-hourly forecast maps of air temperature at 2 meters in Kelvin in the Iberian Peninsula, generated with the AROME model at 00UTC for the next 48 hours. This visualization service includes the individual layers and also a multidimensional layer that brings all of them together.
-
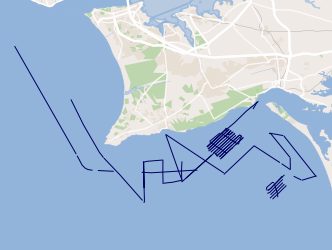
This project aims to characterize the evolution of the coastline during the Quaternary and discern what were the contributions to this evolution: 1) neotectonic, 2) eustatic variations and 3) sedimentary transport.
-
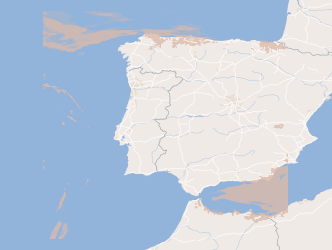
Web Map Visualization, INSPIRE (ISO19128-WMS 1.3.0) compliance, of the Annual Map of the number of days with minimum air temperature ≥20ºC (Number of tropical nights) in the period 1971-2000, obtained by ordinary kriging from the surface observations network of climatological stations of the Institute of Meteorology and the pluviometric stations from INAG.
-
Web Map Visualization, INSPIRE (ISO19128-WMS 1.3.0) compliance, of the Annual Map of the number of days with precipitation ≥1mm (Number of days with precipitation) in the period 1971-2000, obtained by ordinary kriging from the surface observations network of climatological stations of the Institute of Meteorology and the pluviometric stations from INAG for Portugal mainland
-
Three-hourly forecast maps of low cloud cover in percentage in the Iberian Peninsula, generated with the AROME model at 00UTC for the next 48 hours. This visualization service includes the individual layers and also a multidimensional layer that brings all of them together.
-

Notifications concerning marine casualties and marine incidents occurring in the Portuguese territorial waters and in internal waters and with Portuguese flaged vessels in any part of the world.
-
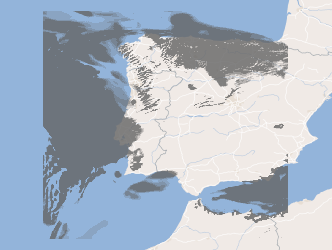
Three-hourly forecast maps of total cloud cover in percentage in the Iberian Peninsula, generated with the AROME model at 00UTC for the next 48 hours. This visualization service includes the individual layers and also a multidimensional layer that brings all of them together.