
Creation year
2016
241 record(s)
Type of resources
Available actions
INSPIRE themes
Provided by
Years
Formats
Representation types
Update frequencies
Status
Service types
Scale
Resolution
geoDescCode
cartografia
geographicCoverage
geographicCoverageDesc
inspirecore
hvd
referenceDateRange
denominatorRange
resolutionRange
dataPolicy
openServiceType
dataType
dataFormat
-
Visualization service (WMS) from monthly maximum air temperature, mean values of the period 1971-2000, obtained by multivariate regression with altitude and distance to the coast, explanatory variables, and ordinary kriging of residues.
-
Map of the seasonal maximum air temperature, mean values of the period 1971-2000, obtained by multivariate regression with altitude and distance to the coast, explanatory variables, and ordinary kriging of residues.
-
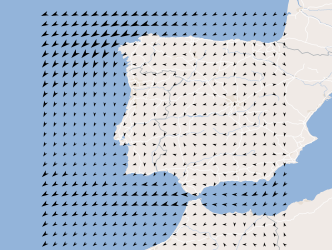
Three-hourly forecast maps of wind direction and intensity at 10 meters in the Iberian Peninsula, generated with the AROME model at 00UTC for the next 48 hours. This visualization service includes the individual layers and also a multidimensional layer that brings all of them together.
-
Map of the seasonal maximum air temperature, mean values of the period 1971-2000, obtained by multivariate regression with altitude and distance to the coast, explanatory variables, and ordinary kriging of residues.
-
Visualization service (WMS) from monthly total precipitation, during the period 1971-2000, obtained by multivariate regression with altitude and distance to the coast, explanatory variables, and ordinary kriging of residues.
-
Map of the seasonal minimum air temperature, mean values of the period 1971-2000, obtained by multivariate regression with altitude and distance to the coast, explanatory variables, and ordinary kriging of residues.
-
Map of the seasonal mean air temperature, mean values of the period 1971-2000, obtained by multivariate regression with altitude and distance to the coast, explanatory variables, and ordinary kriging of residues.
-

Three-hourly forecast maps of low cloud cover in percentage in the Iberian Peninsula, generated with the AROME model at 12UTC for the next 48 hours. This visualization service includes the individual layers and also a multidimensional layer that brings all of them together.
-
Visualization service (WMS) from Map of the monthly minimum air temperature, mean values of the period 1971-2000, obtained by multivariate regression with altitude and distance to the coast, explanatory variables, and ordinary kriging of residues.
-
Visualization service (WMS) from Map of the monthly total precipitation, during the period 1971-2000, obtained by multivariate regression with altitude and distance to the coast, explanatory variables, and ordinary kriging of residues.