
Contact for the resource
Instituto Português do Mar e da Atmosfera, I.P. (IPMA, I.P.)
345 record(s)
Type of resources
Available actions
INSPIRE themes
Provided by
Years
Formats
Representation types
Update frequencies
Status
Service types
Scale
Resolution
geoDescCode
cartografia
geographicCoverage
geographicCoverageDesc
inspirecore
referenceDateRange
denominatorRange
resolutionRange
dataPolicy
openServiceType
dataType
dataFormat
-
Map of the seasonal minimum air temperature, mean values of the period 1971-2000, obtained by multivariate regression with altitude and distance to the coast, explanatory variables, and ordinary kriging of residues.
-
Visualization service (WMS) from Map of the monthly maximum air temperature, mean values of the period 1971-2000, obtained by multivariate regression with altitude and distance to the coast, explanatory variables, and ordinary kriging of residues.
-
Visualization service (WMS) from Map of the monthly minimum air temperature, mean values of the period 1971-2000, obtained by multivariate regression with altitude and distance to the coast, explanatory variables, and ordinary kriging of residues.
-
Visualization service (WMS) from Map of the monthly total precipitation, during the period 1971-2000, obtained by multivariate regression with altitude and distance to the coast, explanatory variables, and ordinary kriging of residues.
-
Web Map Visualization, INSPIRE (ISO19128-WMS 1.3.0) compliance, of the Annual Map of the number of days with precipitation ≥1mm (Number of days with precipitation) in the period 1971-2000, obtained by ordinary kriging from the surface observations network of climatological stations of the Institute of Meteorology and the pluviometric stations from INAG for Portugal mainland
-
Visualization service (WMS) from monthly total precipitation, during the period 1971-2000, obtained by multivariate regression with altitude and distance to the coast, explanatory variables, and ordinary kriging of residues.
-
Visualization service (WMS) from monthly maximum air temperature, mean values of the period 1971-2000, obtained by multivariate regression with altitude and distance to the coast, explanatory variables, and ordinary kriging of residues.
-
Visualization service (WMS) from monthly total precipitation, during the period 1971-2000, obtained by multivariate regression with altitude and distance to the coast, explanatory variables, and ordinary kriging of residues.
-
Viewing Service according to the INSPIRE profile (ISO19128-WMS 1.3.0), from the location limits used for the issuance of Meteorological Forecast Reports for Maritime Navigation in the areas of sea of national responsibility (Mainland Portugal, Azores and Madeira), inserted mainly in METAREA II, according to the standards defined by the Global Maritime Distress and Safety System (GMDSS).
-
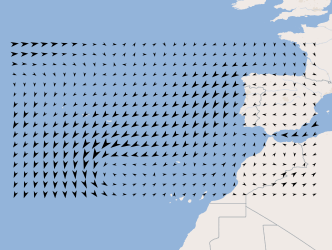
Three-hourly forecast maps of wind direction and intensity at 10 meters in the Atlantic region, generated daily from ECMWF data, with forecasts every 3 hours of the current day from 00h to the next 120 hours. This visualization service includes the individual layers and also a multidimensional layer that brings all of them together.