Resolution
25 m
44 record(s)
Type of resources
Available actions
INSPIRE themes
Provided by
Years
Formats
Representation types
Update frequencies
Resolution
geoDescCode
cartografia
geographicCoverage
geographicCoverageDesc
hvd
referenceDateRange
denominatorRange
resolutionRange
dataPolicy
openServiceType
dataType
dataFormat
-

Modelo batimétrico construído com base na informação de sondagem do Instituto Hidrográfico (IH). Ano(s): 2012 Este conjunto de dados integra os Conjuntos de Dados de Elevado Valor/HVD identificados de acordo com o Regulamento de Execução n.º 2023/138 da Diretiva (UE) 2019/1024, relativa aos dados abertos e à reutilização de informações do setor público
-
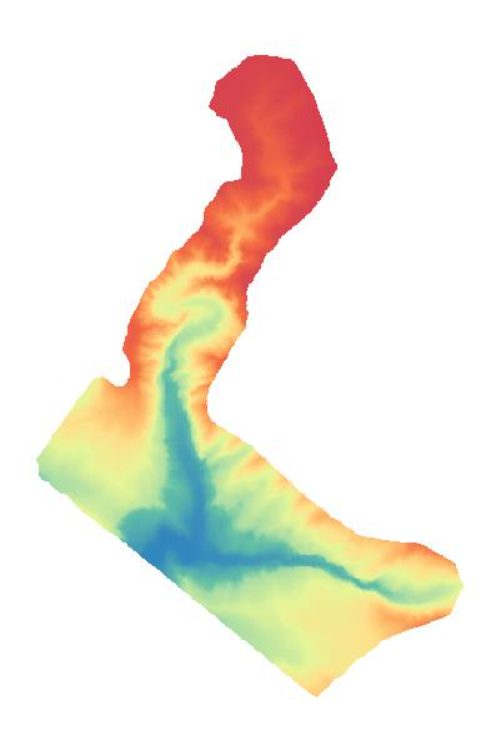
Modelo batimétrico construído com base na informação de sondagem do Instituto Hidrográfico (IH). Ano(s): 2015 Este conjunto de dados integra os Conjuntos de Dados de Elevado Valor/HVD identificados de acordo com o Regulamento de Execução n.º 2023/138 da Diretiva (UE) 2019/1024, relativa aos dados abertos e à reutilização de informações do setor público
-

Modelo batimétrico construído com base na informação de sondagem do Instituto Hidrográfico (IH). Ano(s): 2016. Este conjunto de dados integra os Conjuntos de Dados de Elevado Valor/HVD identificados de acordo com o Regulamento de Execução n.º 2023/138 da Diretiva (UE) 2019/1024, relativa aos dados abertos e à reutilização de informações do setor público.
-
Modelo Digital do Terreno (MDT) de Portugal Continental com espaçamento de 25 m, construído a partir da Altimetria em formato vetorial à escala 1:50 000.
-
This product was developed by LNEG with a view to the future identification of “Renewable Acceleration Areas” for the deployment of renewable electricity production plants in Mainland Portugal. The work took place within the scope of an informal Working Group, coordinated by LNEG and involving: the Portuguese Environment Agency (APA), the General Directorate of Energy and Geology (DGEG), the General Directorate of Territory (DGT), the Institute of Conservation of Nature and Forests (ICNF) and the General Directorate of Cultural Heritage (DGPC). The map identifies the areas in m2 of mainland Portugal with the least sensitivity (environmental, cultural heritage and other) which as such may be considered in the definition of future renewable "Acceleration Areas" within the framework of the revised RED Directive (Renewable Energy Directive. As these areas are not covered by exclusion conditions regarding the preservation of environmental and heritage values (among other), a simplified permitting process for renewable power production plants (solar photovoltaic and wind) could be established, thus allowing to accelerate its implementation without compromising other environmental and territorial values. The mapped areas are preferred areas from the point of view of simplifying the permitting process, but they are not exclusive. In other words, renewable power plants can be implemented in other locations following the normal permitting process. It should be noted that the presented results reflect the situation as of June 2023, and much of the information used is dynamic in nature, meaning this product must be periodically updated. This document is complemented with several electronic Geographic Information System (GIS) files containing the supporting data produced/compiled and collected. Last but not least, this first mapping focuses exclusively on non-artificialized areas. Although the implementation of renewables in a distributed manner in a built/artificialized environment is essential for the country, the analysis of this scope is carried out in another work.
-
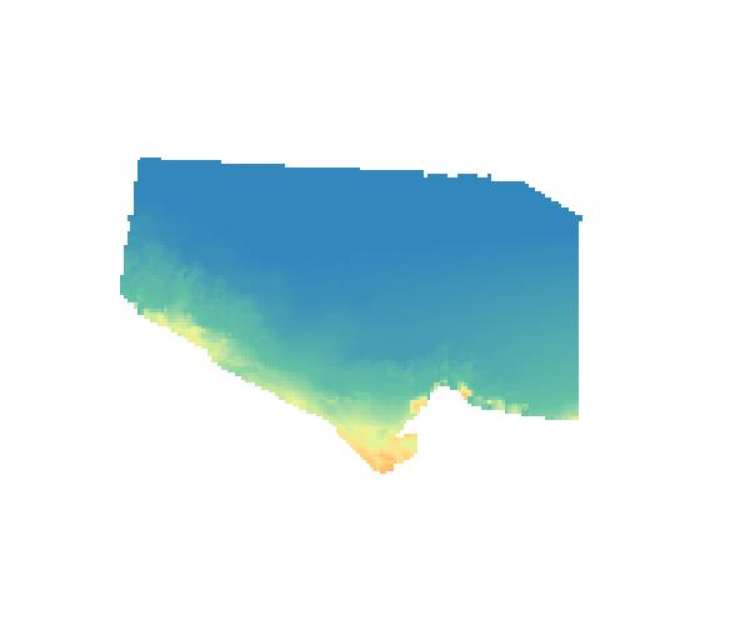
Modelo batimétrico construído com base na informação de sondagem do Instituto Hidrográfico (IH). Ano(s): 2008. Este conjunto de dados integra os Conjuntos de Dados de Elevado Valor/HVD identificados de acordo com o Regulamento de Execução n.º 2023/138 da Diretiva (UE) 2019/1024, relativa aos dados abertos e à reutilização de informações do setor público.
-
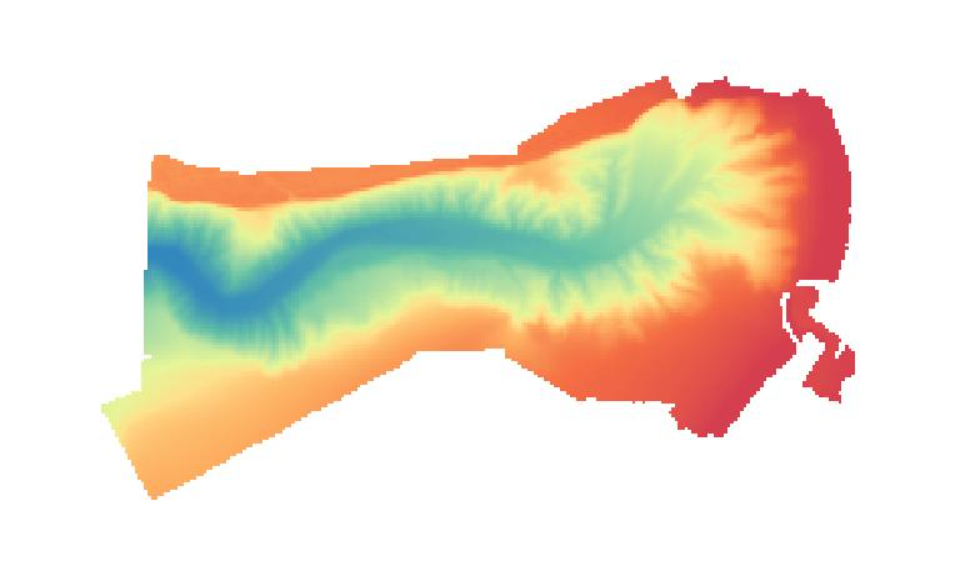
Modelo batimétrico construído com base na informação de sondagem do Instituto Hidrográfico (IH). Ano(s): 2011 Este conjunto de dados integra os Conjuntos de Dados de Elevado Valor/HVD identificados de acordo com o Regulamento de Execução n.º 2023/138 da Diretiva (UE) 2019/1024, relativa aos dados abertos e à reutilização de informações do setor público.
-
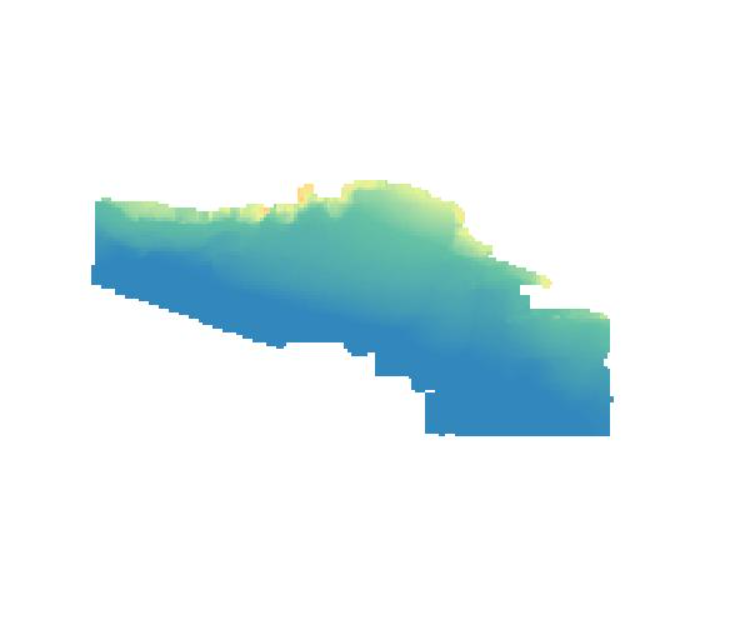
Modelo batimétrico construído com base na informação de sondagem do Instituto Hidrográfico (IH). Ano(s): 2008. Este conjunto de dados integra os Conjuntos de Dados de Elevado Valor/HVD identificados de acordo com o Regulamento de Execução n.º 2023/138 da Diretiva (UE) 2019/1024, relativa aos dados abertos e à reutilização de informações do setor público.
-
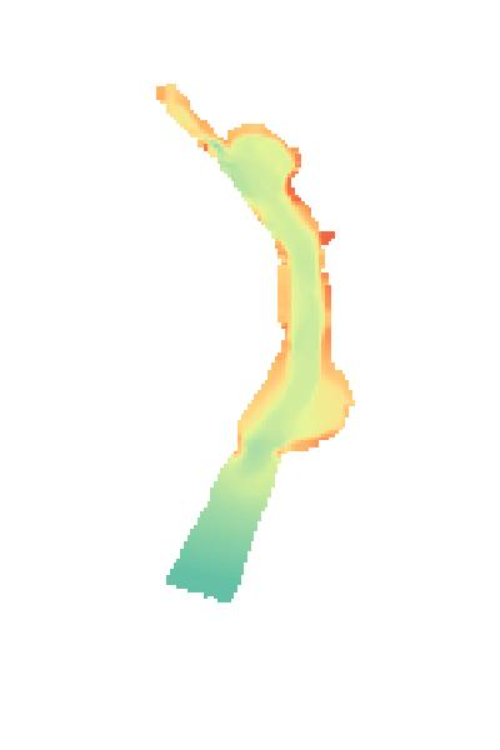
Modelo batimétrico construído com base na informação de sondagem do Instituto Hidrográfico (IH). Ano(s): 2015. Este conjunto de dados integra os Conjuntos de Dados de Elevado Valor/HVD identificados de acordo com o Regulamento de Execução n.º 2023/138 da Diretiva (UE) 2019/1024, relativa aos dados abertos e à reutilização de informações do setor público.
-
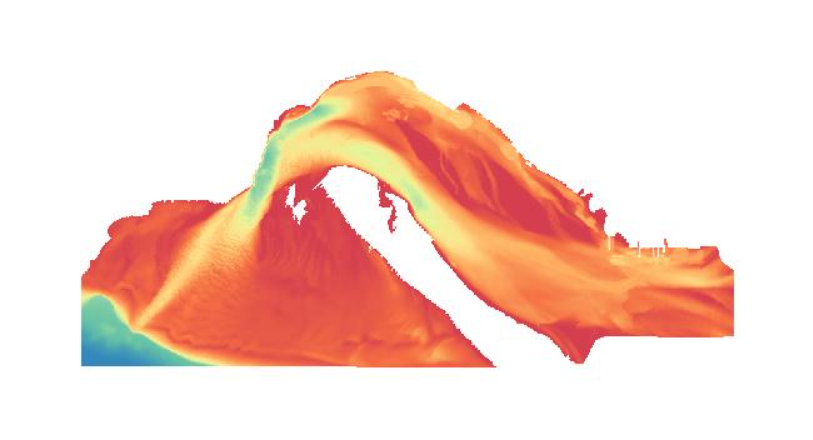
Modelo batimétrico construído com base na informação de sondagem do Instituto Hidrográfico (IH). Ano(s): 1992 a 2011. Este conjunto de dados integra os Conjuntos de Dados de Elevado Valor/HVD identificados de acordo com o Regulamento de Execução n.º 2023/138 da Diretiva (UE) 2019/1024, relativa aos dados abertos e à reutilização de informações do setor público.
