
Keyword
Nebulosidade
8 record(s)
Type of resources
INSPIRE themes
Provided by
Years
Formats
Representation types
Update frequencies
Status
Service types
Scale
Resolution
geoDescCode
cartografia
geographicCoverage
geographicCoverageDesc
referenceDateRange
denominatorRange
resolutionRange
dataPolicy
openServiceType
dataType
dataFormat
-
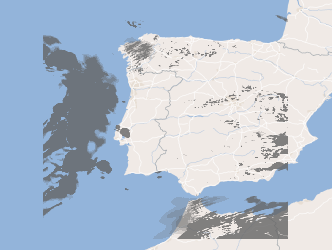
Three-hourly forecast maps of total cloud cover in percentage in the Iberian Peninsula, generated with the AROME model at 12UTC for the next 48 hours. This visualization service includes the individual layers and also a multidimensional layer that brings all of them together.
-

Three-hourly forecast maps of low cloud cover in percentage in the Iberian Peninsula, generated with the AROME model at 12UTC for the next 48 hours. This visualization service includes the individual layers and also a multidimensional layer that brings all of them together.
-
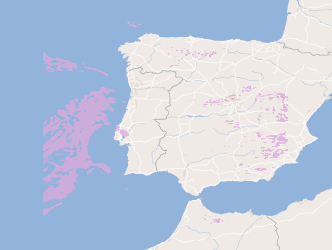
Three-hourly forecast maps of medium cloud cover in percentage in the Iberian Peninsula, generated with the AROME model at 12UTC for the next 48 hours. This visualization service includes the individual layers and also a multidimensional layer that brings all of them together.
-
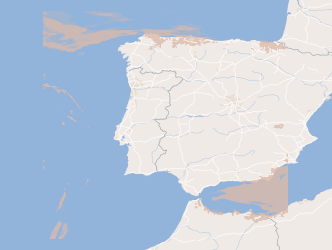
Three-hourly forecast maps of low cloud cover in percentage in the Iberian Peninsula, generated with the AROME model at 00UTC for the next 48 hours. This visualization service includes the individual layers and also a multidimensional layer that brings all of them together.
-
Three-hourly forecast maps of total cloud cover in percentage in the Iberian Peninsula, generated with the AROME model at 00UTC for the next 48 hours. This visualization service includes the individual layers and also a multidimensional layer that brings all of them together.
-
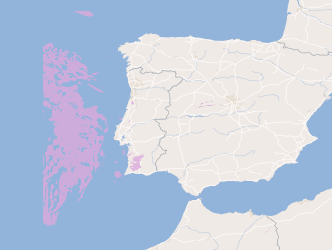
Three-hourly forecast maps of medium cloud cover in percentage in the Iberian Peninsula, generated with the AROME model at 00UTC for the next 48 hours. This visualization service includes the individual layers and also a multidimensional layer that brings all of them together.
-
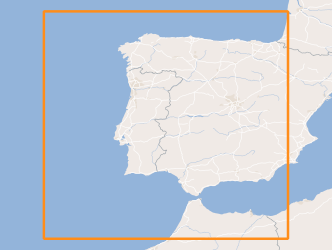
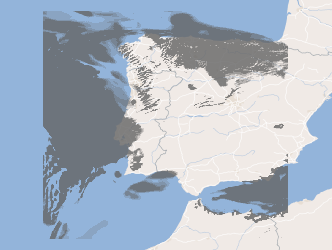
Three-hourly forecast maps of cloud cover in percentage at three levels (low, medium and high) and total cloud cover for the Iberian Peninsula, generated with the AROME model. The maps are generated twice a day, at 00UTC and 12UTC, with forecasts of the following 48 hours.
-
Digital archive of the analyzes of the surface charts of 00 UTC and 12 UTC, held in IM and IPMA Weather Forecast Center since October 2015. In the surface analysis charts, the isobars are filled up every 5 hPa, the high pressure centers (A) and the low pressure centers (B). Frontal surfaces, crest lines, valley lines, lines of instability and convergence are represented according to the standards established by the WMO. This compilation is in digital format (pdf) with a total of 1094 charts.