Contact for the resource
National Laboratory of Energy and Geology, P.I.
66 record(s)
Type of resources
Topics
INSPIRE themes
Keywords
Contact for the resource
Provided by
Representation types
Update frequencies
Service types
Scale
-
The “National Atlas of Sustainable Green H2” is a tool based on georeferenced information that follows defined criteria in the development of scenarios to assess the suitability of the location of green hydrogen production projects with regard to: (i) necessary resources to power hydrogen production plants through water electrolysis; (ii) land use conditions for the implementation of green hydrogen production units, and (iii) factors that enhance the commercialization of the produced hydrogen. Based on this “National Atlas of Sustainable Green H2” tool, we present 4 maps referring to 4 scenarios that identify the “best” areas for green hydrogen production according to the basic rationale of each scenario. The 4 maps represent the following scenarios: scenario A “Diversified”, scenario B “Drought, Gas Grid and Transport”; scenario C “Drought and gas consumers”; scenario D “Prospective”. Each scenario was developed based on 3 sub-indices (i) proximity to water sources, (ii) proximity to energy sources and (iii) ease of commercializing green H2 on the market. The water sub-index consists of a maximum of 7 indicators considering the proximity to the following potential water sources: surface water bodies, wastewater treatment plants (WWTPs), public water network, groundwater, seawater, multi-purpose irrigation grid, water scarcity index. The energy sub-index consists of a maximum of 6 indicators, namely: solar resource, onshore wind resource, offshore wind resource, proximity to bioelectricity producers, proximity to hydropower producers, proximity to the power grid. Finally, the market sub-index is made up of a maximum of 5 indicators, including proximity to: potential industry consumers of H2, potential transport consumers of H2, potential consumers of H2 as raw material, large CO2 emitters. Each final map excludes from potential project locations land occupation that proves to be inappropriate. The following are not yet considered: easements and public utility restrictions, RAN and REN areas, Territorial Planning Plans, municipality land planning (PDM), SEVESO Directive hazardous zones, protected areas under the Water Framework Directive , seismicity, flood risk and/or geologically unstable areas (erosion, landslides, etc.). This Atlas requires a detailed analysis of sites considering all applicable legislation. The geographic information used has inherent limitations regarding date, scale, resolution and sources. Furthermore, the viability assessment for a specific project requires detailed information that goes beyond the variables contained in this Atlas and considers other decision-making and legal compliance factors, which cannot be considered at this scale.
-
-
-
-

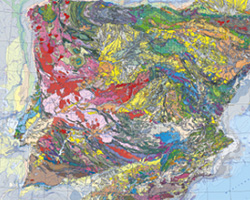
The geological map of Spain and Portugal at 1:1 000 000 scale is a renewed version of the geological map of the Iberian Peninsula and the territories of Ceuta, Melilla and the Balearic, Canaries, Azores and Madeira islands. This small-scale map is edited jointly periodically by the Geological surveys of Spain (IGME) and Portugal (LNEG). This new version includes for the first time the geological information of the Spanish and Portuguese continental shelves and also the geology of the Atlantic Portuguese islands. This map records all the new geological knowledge provided by the complete survey at 1:50 000 scale in Spain (IGME’s MAGNA Plan) and the systematic geological mapping series developed in Portugal by the LNEG. The continental portion of the map was compiled starting from original drafts at 1:400 000 scale made for every main geological unit: Iberian Variscan Massif, Pyrenees, Betics, Cantabrian and Iberian cordilleras and the Duero, Ebro and Tajo Cenozoic basins for the territory of Spain and the geological maps at 1:200 000 scale in Portugal.
-
Web map service of the onshore and offshore borehole database of the national territory carried out by the National Laboratory of Energy and Geology (LNEG) or private operators and respective technical reports.
-
Web map service of the Radiometric Map of Mainland Portugal.
-
Web feature service of the Portuguese HydroGeological Resources Database which provides access to geological and hydrogeological information for drill holes, wells, springs and boreholes.
-
INSPIRE download service providing Portugal onshore geological map data at 1:200 000 scale. Layers depicting Geologic Units classified according to ages and lithologies from INSPIRE vocabularies are available.
-
Web feature service of the onshore and offshore borehole database of the national territory carried out by the National Energy and Geology Laboratory (LNEG) or private operators and respective technical reports.
