
Keyword
Climatology, meteorology, atmosphere
88 record(s)
Type of resources
Topics
INSPIRE themes
Keywords
Contact for the resource
Provided by
Representation types
Update frequencies
Status
Scale
-
Digital archive of the analyzes of the surface charts of 00 UTC and 12 UTC, held in IM and IPMA Weather Forecast Center since October 2015. In the surface analysis charts, the isobars are filled up every 5 hPa, the high pressure centers (A) and the low pressure centers (B). Frontal surfaces, crest lines, valley lines, lines of instability and convergence are represented according to the standards established by the WMO. This compilation is in digital format (pdf) with a total of 1094 charts.
-

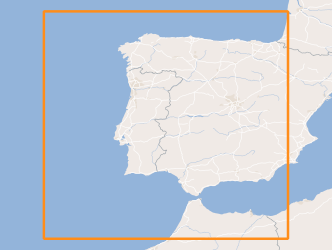
Three-hourly forecast maps of wind (u component + v component) at 10 meters in the Iberian Peninsula, generated with the AROME. The maps are generated twice a day, at 00UTC and 12UTC, with forecasts of the following 48 hours.
-
Climate normal from Annual Map of the number of days with minimum air temperature ≥20ºC (Number of tropical nights) in the period 1971-2000, obtained by ordinary kriging from the surface observations network of climatological stations of the Institute of Meteorology and the pluviometric stations from INAG.
-
Three-hourly forecast maps of cloud cover in percentage at three levels (low, medium and high) and total cloud cover for the Iberian Peninsula, generated with the AROME model. The maps are generated twice a day, at 00UTC and 12UTC, with forecasts of the following 48 hours.
-
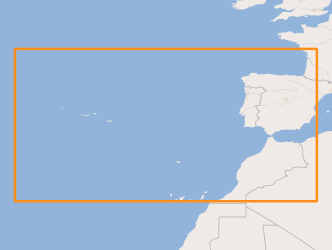
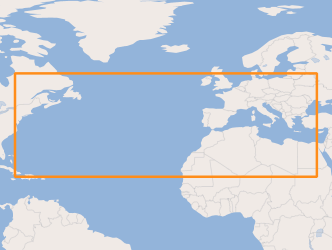
Three-hourly forecast maps of total column water vapour in kg m-2 in the Atlantic region, generated from ECMWF data twice a day, at 00UTC and 12UTC, with forecasts every 3 hours of the current day from 00h to the next 120 hours.
-
Map of the monthly minimum air temperature, mean values of the period 1971-2000, obtained by multivariate regression with altitude and distance to the coast, explanatory variables, and ordinary kriging of residues.
-
Map of the seasonal total precipitation, during the period 1971-2000, obtained by multivariate regression with altitude and distance to the coast, explanatory variables, and ordinary kriging of residues.
-
Map of the monthly total precipitation, during the period 1971-2000, obtained by multivariate regression with altitude and distance to the coast, explanatory variables, and ordinary kriging of residues.
-
Map of the monthly mean air temperature, mean values of the period 1971-2000, obtained by multivariate regression with altitude and distance to the coast, explanatory variables, and ordinary kriging of residues.
-
Climate normal from annual total precipitation, during the period 1971-2000, obtained by multivariate regression with altitude and distance to the coast, explanatory variables, and ordinary kriging of residues.